Noisy IQ Tests
Certain private schools target “gifted” students, which usually means (among other things) scoring 130 or above on an IQ test.
Here is my “hot take” (that may or may not be true):
Assuming that IQ test score is a noisy measure of a student’s “real IQ”, then the average IQ of accepted students is probably below 130, even though every single student scored above a 130 on an IQ test.
Here is an intuitive explanation of why this might be true. There are way more people with a real IQ of <130 than >130. If there’s enough noise in the IQ test score, then the number of people who have a real IQ of <130 but score >130 because of random noise will be more than the number of people who have a real IQ >130.
Our Model
Now let’s introduce a more realistic model (but clearly still flawed):
- The real IQ of a randomly chosen person is normally distributed with a mean of 100 and a stdev of 15.
- Your test IQ score will be your real IQ + some random noise. We will refer to this noise as the “test noise”. Test noise is also normally distributed with 0 mean and some stdev. We will vary the stdev of the test noise throughout this post to see how that affects the conclusions we can draw.
- Applicants to this hypothetical “gifted” private school are randomly chosen from the population.
- All applicants with a test score >= 130 are accepted.
Extreme cases
Extreme cases are a good way to build intuition, so let’s start there.
No test noise
What is the average IQ of accepted students if the stdev of the test noise is 0?
Average “real IQ” (which equal test IQ in this case): 135.6
What percent of applicants are accepted if the stdev of the test noise is 0?
About 2.2% of applicants are accepted. You may remember that about 4% of (normally distributed) data lies more than 2 stdev away from the mean. An IQ of 130 is two stdevs above the mean of 100. We only care about >130 and not <70 and so we cut that 4% in half.
Massive test noise
Same two questions, but now let’s assume the stdev of test noise is 100.
What is the average IQ of accepted students if the stdev of the test noise is 100?
Average “real IQ”: 102
What percent of applicants are accepted if the stdev of the test noise is 100?
About 38%.
This makes some intuitive sense. If the test noise is that large, it’s almost as if real IQ doesn’t even matter. The school will essentially randomly accept applications. So the average real IQ should be very close to the average IQ of the population (which it does) and the percent of applicants accepted should be close to 50% (close enough).
More realistic cases
What is the average IQ of accepted students if the stdev of the test noise is 10?
Average “real IQ”: 126 (and about 4.8% of applicants would be accepted)
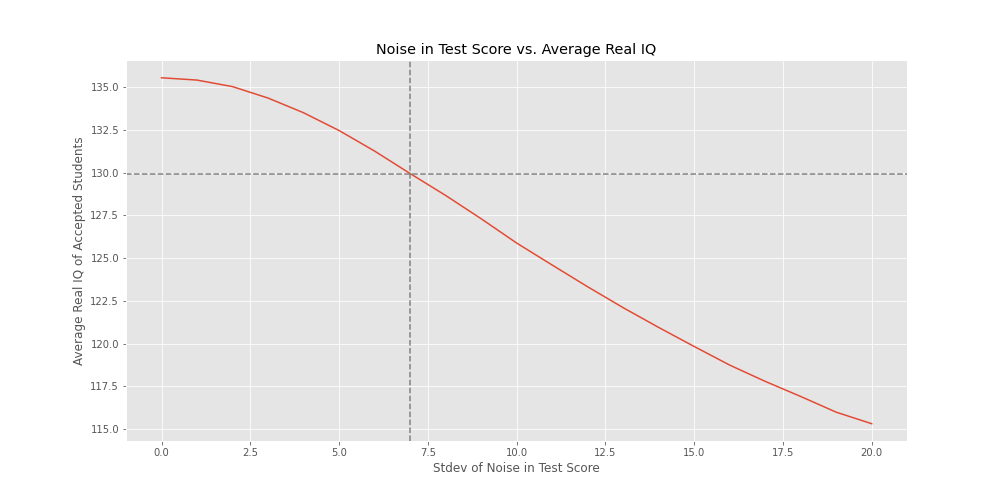
What would the stdev of test noise have to be to make the average IQ of accepted students 130?
About 7. So
- if the stdev of test noise is > 7, then the average IQ of accepted students will be < 130
- if the stdev of test noise is < 7, then the average IQ of accepted students will be > 130
Here we show a graph of (stdev of) test noise vs. average real IQ. You can see that as the noise increases, the average real IQ decreases.
Assuming the stdev of test noise is 10, what is the average “real IQ” of students who scored 130?
Technical aside: nobody scores exactly 130, so we bucket scores and take averages.
Answer: About a 121.
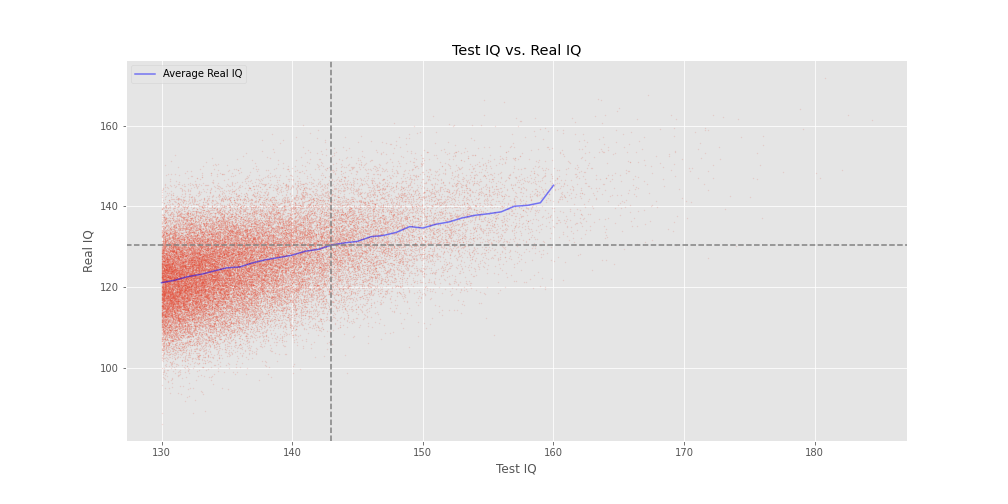
Assuming the stdev of test noise is 10, what is the lowest test IQ score such that the average “real IQ” given that test score is >=130?
Answer: About a 143.
I think this is the answer that I find most interesting in the entire post. To put this in simple terms, you’re probably not nearly as smart as your test IQ suggests! If you score a 140, you’re probably not even 130. Now, this is assuming a test noise of 10, which may be way too high – I don’t know – but it seems at least plausible to me.
Here is a graph of Test IQ vs. Real IQ. Each red dot represents a single person who has both a real IQ and a test IQ score. The blue line represents the average real IQ for each test IQ score. The dashed lines intersect at the point where the average real IQ crosses the 130 threshold (about a 143 test IQ score).
Multiple tests
The model we used above has many flaws, but here’s a big one: applicants can take more than one test!. As long as they score about 130 on any IQ test, they can apply. Let’s tweak our model in the following way:
- Assume each applicant takes 3 IQ tests and use the maximum score to apply.
I won’t go through the entire sequence of questions above again, but here are the highlights:
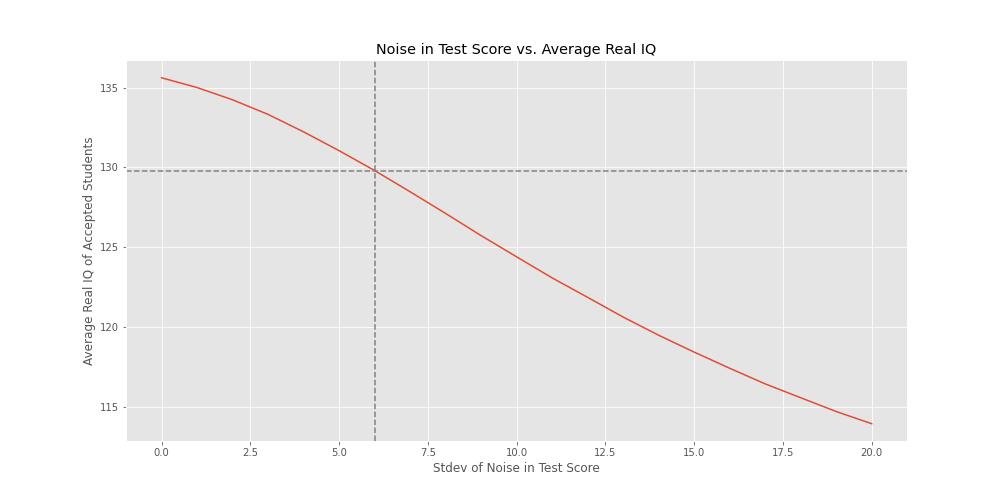
- Average Real IQ assuming test noise of 10: 124 (2 points lower)
- Test noise stdev s.t. average real IQ is 130: ~6 (1 less)
- Average Real IQ given a test score of 130: 119 (2 points lower)
- Minimum test score s.t. average real IQ is >=130: 145 (2 points higher)
And here are the same 2 graphs, now assuming applicatings take 3 tests:
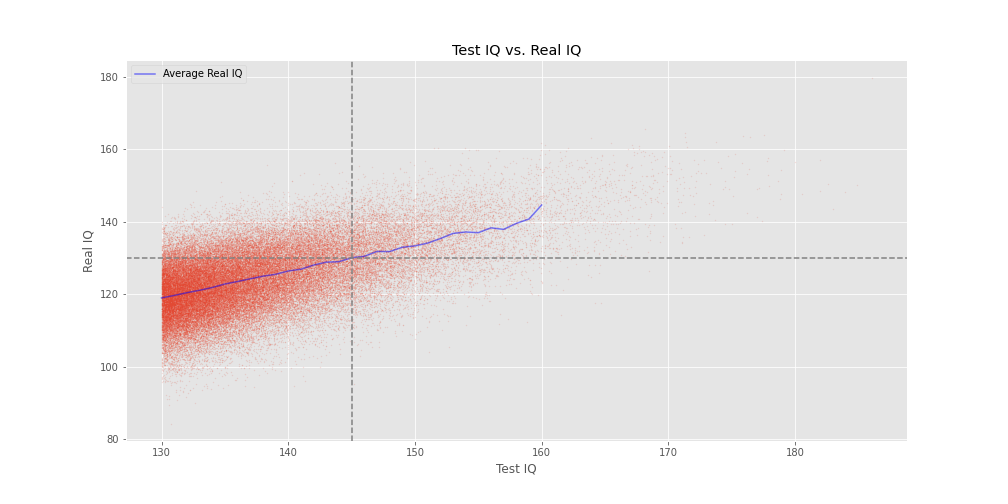
I’m actually surprised that taking the maximum of 3 tests didn’t affect the results even more. My intuition was that it would have a bigger effect.
More Incorrect Assumptions
Like I said above, our model – even assuming multiple tests – is still pretty unrealistic. Here are two reasons why:
- The higher the real IQ, the more likely a student is to apply to a gifted school. So the assumption that applicants are randomly chosen from the population is wrong.
- I suspect that test IQ score are noisy, but they’re not symmetrically noisy. It seem much more likely for a student to score well below their “real IQ” score than for them to score well above it. For example, if a student is sick and can’t focus on the test day, they may get a score well below their potential. It’s hard to come up with similarly plausible reasons for why they might score well above their potential. This is just an intuitive claim - I have no actual evidence to support this.