How good is Elo for predicting chess?
Elo is a general-purpose rating system for two-player, zero-sum games, such as chess. Given the rating of two opponents, it gives a prediction for the outcome of a match between them. The prediction comes in the form of the expected score of a player in the match, where a win counts as a score of \(1\) and a draw counts as a score of \(\frac{1}{2}\). Here is the formula for the expected score:
If Player A has a rating of \(R_{A}\) and Player B a rating of \(R_{B}\), the exact formula for the expected score of Player A is \(\frac{1}{1 + 10^{(R_B - R_A)/400}}\)
Just to make sure it’s clear, let’s work through some examples.
| \(R_A\) | \(R_B\) | Expected score of Player A | Expected score of Player B |
|---|---|---|---|
| 100 | 100 | 0.5 | 0.5 |
| 100 | 0 | 0.64 | 0.36 |
| 200 | 0 | 0.76 | 0.24 |
| 400 | 200 | 0.76 | 0.24 |
| 400 | 0 | 0.91 | 0.09 |
| 600 | 0 | 0.97 | 0.03 |
A few quick notes.
- If the scores are the same, the expected scores of each player are the same.
- The expected scores of the two players always sum to 1.
- The expected scores of the two players only depends on the (absolute) difference between the players’ ratings. The absolute ratings don’t matter.
Those all seem like nice, sensible properties for a rating system to have. However, does it work?
It just so happens that I’ve recently come across a fantastic (open) data set for chess (here). It’s a collection of about 500 million chess games played on the popular lichess site. One very neat property of this data set is that, since all these games were recorded automatically by the website, the data set is very likely error free! What a nice starting point.
Back to the problem at hand, we can now evaluate how good the Elo formula is at predicting the outcome of real-life chess games. I’ve downloaded about 10M games and plotted the average score (of the better player) by the difference in Elo rating. On the same plot, I’ve also included the average score that the Elo formula would predict. Lastly, I’ve included a prediction by a formula that has the same form as the Elo formula, but with slightly different constants that seem to fit the data quite a bit better.
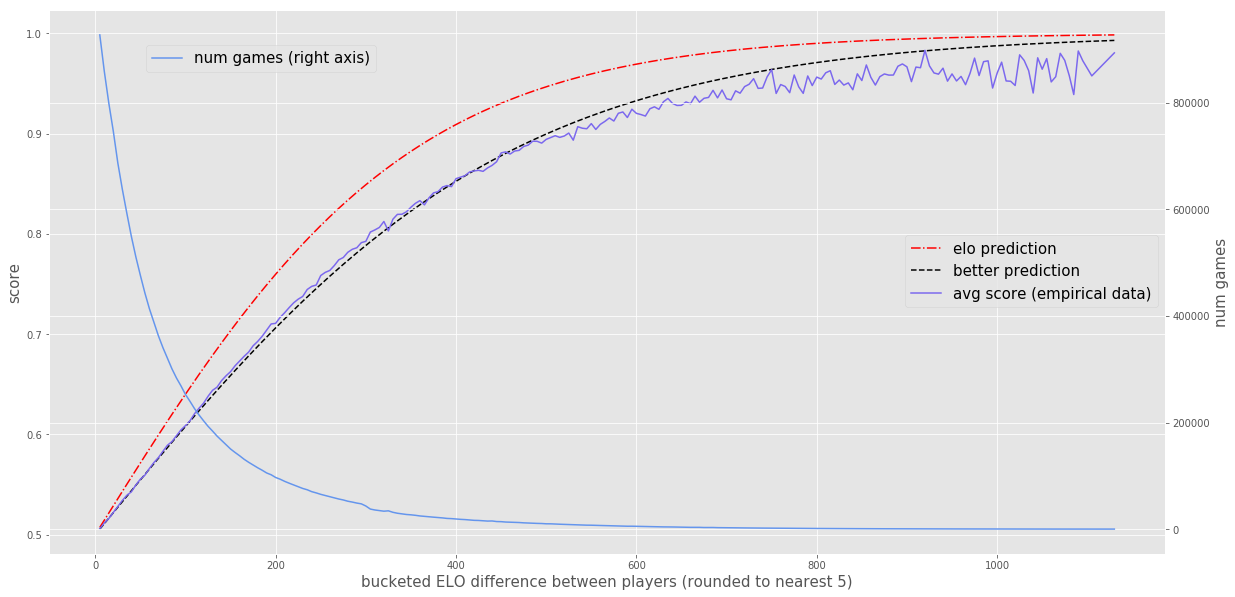
It seems like the Elo prediction (the red dotted line) has a decently good shape, but it systematically overpredicts the score of the better player. The formula that seems to fit the data quite a bit better (the black dotted line) is the following:
\[\frac{1}{1 + 10^{(R_B - R_A)/525}}\]The only difference is that the denominator of the exponent is 525 instead of 400, which means that this new formula would predict the same score as the old formula when the Elo rating diff was 525 instead of 400, or more generally, when the Elo rating difference was about 30% larger.
Both formulas seem to fairly dramatically overestimate the probability that the better player will win when the Elo difference is extremely large (over 800 points or so). I guess even great chess players make dumb mistakes every once in a while. The data also gets pretty clearly noisy when the difference is that large, since there aren’t many games between players whose ratings differ by that much. When would that even happen? It turns out that there are some tournaments that accept all rating levels and (at least at the start of the tournament) randomly pair opponents against each other. You may question how seriously the better players are taking those types of tournaments. Anyways, I can continue making excuses for the better player, but I should also probably believe the data to some extent and update my prior on how often a very good player can lose to a much worse one.