Measuring Confidence
At the start of each year, Ron Minsky (from Jane Street) runs a friendly competition where participants are invited to make some predictions about the next year. More specifically, there are 10 events which may or may not happen in the next year and, for each event, participants are asked to give a probability that they will happen. Then, at the end of the year, the predictions are scored. Here’s an example event from 2024: There will be a presidential debate between Joe Biden and Donal Trump (both of whom attend.)
How are they scored? According to the following formula:
\[\text{score}(p, \text{outcome}) = \begin{cases} \ln(p) & \text{if outcome is true} \\ \ln(1-p) & \text{if outcome is false} \end{cases} - \ln(0.5)\]For this scoring function, you should think of each prediction $p$ as a probability between 0 and 1, with 0 representing 0% that the event will happen, and 1 representing 100% that the event will happen. We subtract $ln(0.5)$ so that your score is always 0 if you guess 50%. This also means that if you were directionally right, your score will be positive, and if you were directionally wrong, your score will be negative.
Oh, and one more thing: if your prediction $p$ is either 0 or 1 and you end up being wrong, the score for that prediction is negative infinity. So… maybe not the best idea.
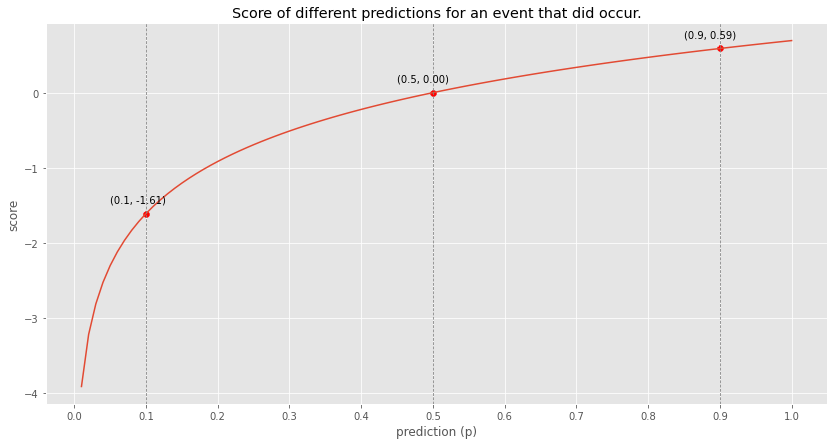
To get a better feel for the scoring function, here is the scoring function for an event that did occur (so higher predictions are better).
At the end of the year, Ron and his son Zev write up a very amusing recap of how everyone did with a lot of color on the questions. Highly recommend. Here’s their recap for 2024: Subpar Forecasting, 2024.
My contribution
In 2023, I copied them and ran my own miniature competition with a few friends. At the end of the year, I wanted to answer the following question: who should have been “more confident” and who should have been “less confident”?
This was kind of a fun and interesting problem. It’s not clear how to measure this. I definitely don’t think there is a single correct answer to this question, but I came up with a method that I kind of liked. I ended up sharing this with Ron and they ended up using it in their evaluation of 2024! So I thought, I’d explain it here.
The high level idea
(I’m stealing this description from Ron)
The idea is pretty simple: in order to see if you’re overconfident or underconfident, we try scaling your confidence up and down until we find the scaling factor that maximizes your score.
In other words, we make all of your guesses bolder or more cautious to different degrees, and check to see which way gave you the highest score. If your score goes up as we make your guesses more confident, then you’re underconfident. If your score goes up if we make your guesses less confident, you’re overconfident.
Gaining intuition
Let’s imagine someone made the following 3 guesses: 0.5, 0.1, 0.6. How can you make all 3 guesses “twice as confident”? Think about it for yourself if you want.
Before trying to answer that question, let’s just play around with this example to gain some intuition. First off, let’s order the guesses from least confident to most confident: 0.5, 0.6, 0.1.
- A guess of 0.5 is the least confident guess possible; it suggests you don’t have any leaning one way or the other.
- A guess of 0.6 suggests that you think the event in question will happen, but you’re not that confident.
- A guess of 0.1 suggests that you think the event in question won’t happen, and you’re quite confident that it won’t.
So how can we scale all the guesses to make them more confident? We want to push them towards 0 or 1. If the guess is > 0.5, then you should push the guess towards 1 in order to make it more confident. If the guess is < 0.5, then you should push the guess towards 0.
But by how much should we push it? Here is the crux of the problem.
Here’s one thing you can’t do: double the distance from 0.5. With that method, 0.6 would become 0.7 and 0.1 would become… negative 0.3?? That obviously doesn’t work. Any sort of linear adjustment will fail for this reason. Intuitively, the confidence of a guess doesn’t seem to be linearly related to the value of the guess. Going from 0.6 to 0.8 is probably a smaller increase in confidence than going from 0.9 to 0.999999.
Properties I’d like
Now that we have some intuition for what it means to increase and decrease the confidence of a sequence of guesses, here are some properties that I wanted in my solution:
- If I scale the confidence of all guesses by 0, they should become the least confident possible, which means they should all become 0.5.
- If I scale the confidence of all guesses by 1, I should not change the confidence, which means the guesses should stay the same.
- If I scale the confidence of all the guesses by infinity, they should become the most confident possible, which means they should all become either 0 or 1 (or remain at 0.5 in the special case that the original guess was 0.5).
Stop stalling, how did you do it?
One last caveat and I’ll cut to the chase: the method I chose is arbitrary. I think it has some nice properties and it seems to align with my intuitions, but satisfying those propoerties is a very underconstrained problem and so this just one possible method.
To understand my method, let’s consider a different problem: You’re given a biased coin. You’re told that the probability of heads is somewhere between 0 and 1, uniformly distributed.
You’re asked to predict whether the next flip of that coin will be heads, and you’ll be scored according to the scoring rule above (log scoring). What guess maximizes your score?
The answer is 0.5. I won’t prove it, but that’s probably what you thought anyways.
Ok, now you flip the coin once and it comes out heads. Now you’re asked to predict whether the next flip of that coin will be heads (using the same scoring rule). What guess maximizes your score?
This is not obvious (or at least was not to me), but it turns out to be $\frac{2}{3}$.
Ok, so let’s generalize: You’re given this biased coin where the probability of heads is uniformly distributed between 0 and 1. You then flip the coin and see $N$ heads in a row. You’re then asked to predict whether the next coin flip will be heads, and you’ll be scored according to the scoring rule above. What guess maximizes your score?
For any $N$ there will be an answer, right? If $N$ is 0, then your best prediction is 0.5. The larger $N$ becomes, the closer your best prediction goes to 1. This is starting to feel related to confidence. The more heads your see in a row, the more confident you become that the next coin flip will also be heads.
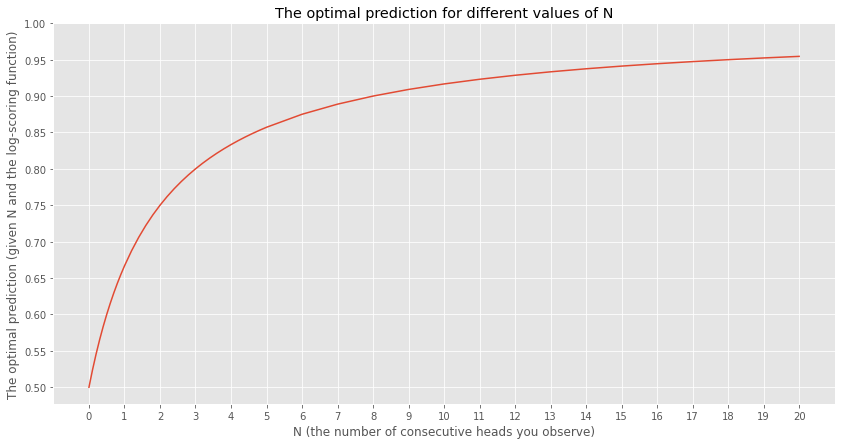
If for any $N$ we can find the optimal prediction, then we can also work backwards. From any prediction, we can back out what the $N$ would have been for you to want to make that prediction. (Note: that for guesses < 0.5, you can think about N as the number of tails instead of heads and everything still works)
This mapping between a prediction $p$ and $N$ is the key to how I ended up scaling the confidence of the predictions. In order to make a series of predictions “twice as confident”, I did the following: For each prediction $p$, map $p$ to its corresponding $N$, multiply $N$ by 2 (in order to double the confidence), and then map the doubled $N$ back to a new $p$.
Let’s do this for the sequence of guesses: 0.5, 0.1, 0.6:
| Original prediction | N | Doubled N | Doubly confident prediction |
|---|---|---|---|
| 0.5 | 0 | 0 | 0.5 |
| 0.1 | 8 | 16 | 0.0555 |
| 0.6 | 0.5 | 1 | 0.666 |
So if you want to double the confidence of the sequence of predictions 0.5, 0.1, 0.6 using my method, you’d end up with 0.5, 0.0555, 0.666.
Evaluating whether someone was under or over confident
Now that we can scale a sequence of predictions by any “confidence scaling factor” we want, the last step is quite intuitive.
In order to evaluate whether someone was under or over confident, you just take their sequence of actual predictions and find the “confidence scaling factor” that maximizes their score. If their score is maximized by scaling the confidence of their guesses by 3, then I guess they should have been more confident! If their score was maximized by scaling the confidence of their guesses by 0.7, then I guess they should have been a little less confident.
To drive this home, let’s consider our example of three predictions again and let’s imagine these were the actual outcomes:
| Original prediction | Outcome | Score |
|---|---|---|
| 0.5 | 1 (it happened) | 0 |
| 0.6 | 0 (it didn’t happen) | -0.223 |
| 0.1 | 0 (it didn’t happen) | 0.5877 |
The total score for these 3 predictions is 0.36. But what confidence scaling factor would maximize the total score?
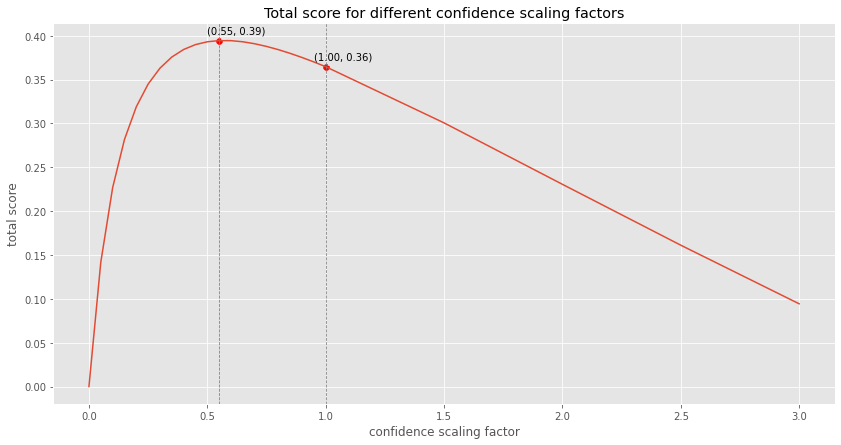
It turns out that in this hypothetical example, a confidence scaling factor of 0.55 would have maximized the total score, meaning that this player was a bit overconfident.
Short summary of the method
I found a mapping between “prediction space” and “confidence space” (for which I used “number of heads”). In order to scale the confidence of a prediction, I mapped it to confidence space, scaled it there, and then mapped it back.
In order to find whether someone should have been more or less confident, I found the scaling factor which maximized their score. If the scaling factor was greater than 1, then they should have been more confident. If the scaling factor was less than 1, they should have been less confident.
The math
This is probably the craziest part of this story to me because the math looks so complicated along the way, but the final result is so simple. Hat tip to Zev for just… somehow intuiting (almost immediately) that this was the solution!? I have no idea how he did that.
Let’s break up the problem into two steps:
- Posterior distribution of the bias of the coin: Recall that we start with a uniform prior on the bias of the coin and then we observe $N$ heads in a row. What is our posterior distribution on the bias? For this, we will use bayes rule.
- Optimal prediction: Given that posterior distribution, what prediction maximizes our score given the log-scoring function?
Posterior distribution on the bias of the coin
Instead of working this out in full generality, let’s just work out a specific example: What is the posterior probability distribution of the bias of the coin after observing 3 heads in a row? Let’s use Bayes’ theorem:
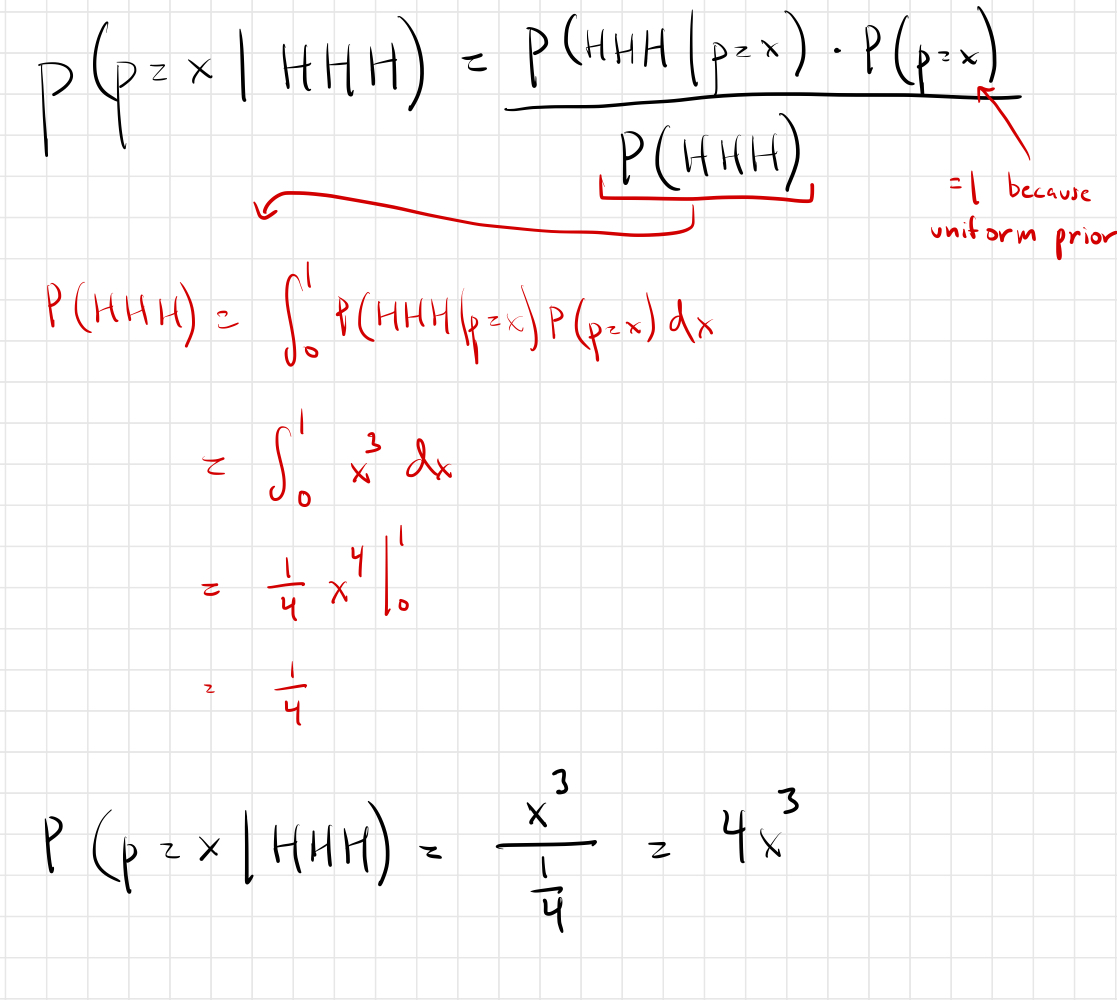
I’m not going to prove it, but it’s pretty easy to see this is the generalization for N heads:

Given a posterior distribution, what prediction maximizes our score?
I’m going to use the variable $g$ for our prediction (our guess), because I’ve aleady used $p$ as the bias of the coin.
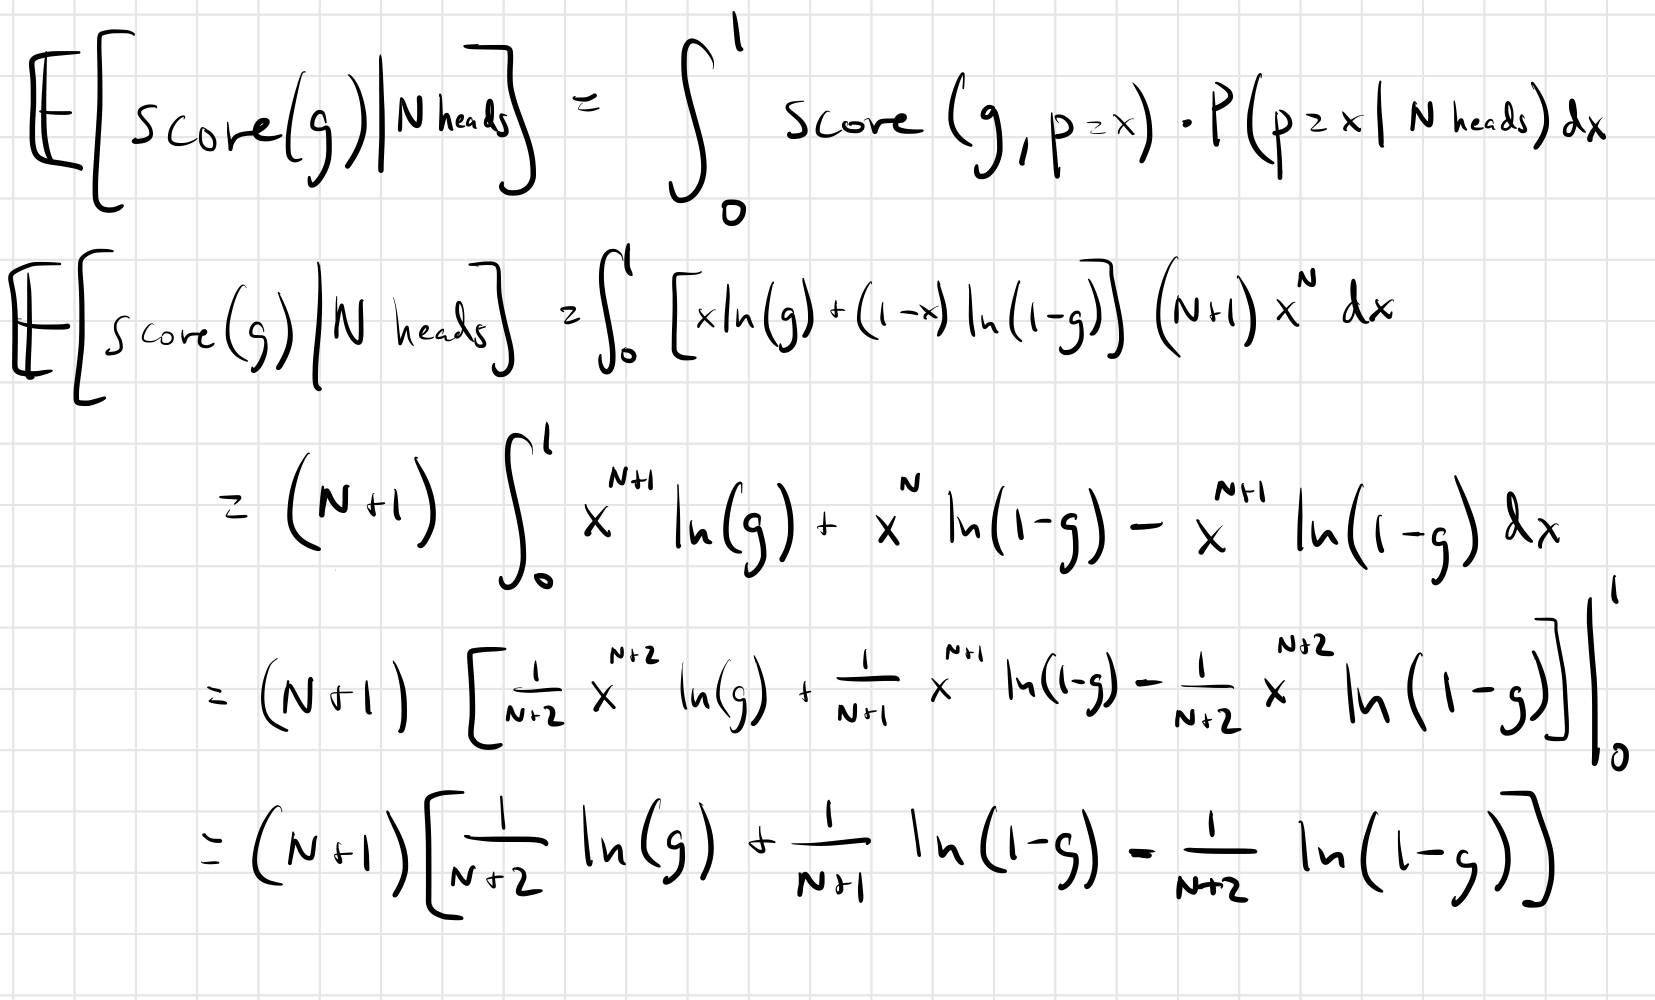
Oof. Looks nasty, but it’s not actually too bad. But we’re not done. That’s the expected score given a prediction of $g$. We need to find the optimal prediction, i.e. we need to maximize the function.
How do you find the maximum of a function? Take the derivative and set it to zero:
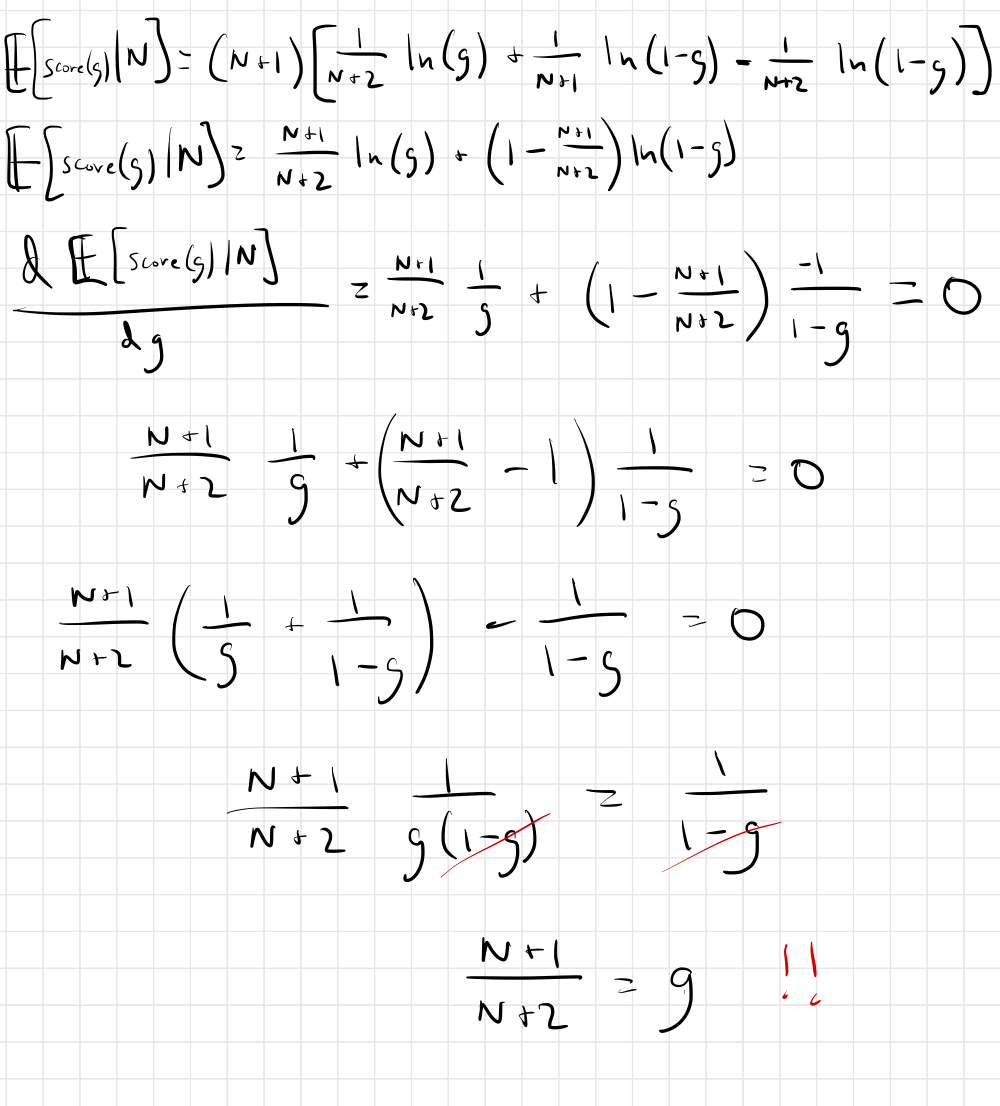
So after all that, the solution is so simple: After seeing N consecutive heads, the prediction that maximizes your expected score is $\frac{N+1}{N+2}$.
This simple formula gives us a way to go from $N$ to the optimal prediction $g$. And to go the other way, you just need to invert it.